Dumps can be of 2 file formats (Every other file type will be discarded):
1. Microsoft DMP file (“MDMP” signature at the beginning of the file)
2. Microsoft DMP file inside a .tar.gz archive
Dumps can be added with 2 different ways:
A. Automatically with a live monitor (see monitor section)
B. Manually with a drag n’ drop (You will need to choose a monitor)
In the “Dumps” tab, dumps are displayed in this order:
__ Monitor A
____ Bug ID1
______ Crash Dump Name 1
____ Bug ID2
______ Crash Dump Name 2
______ Crash Dump Name 3
____ (spinner) Crash Dump being analyzed 1
__ Monitor B
____ Bug ID2
______ Crash Dump Name 1
____ (spinner) Crash Dump being analyzed 2
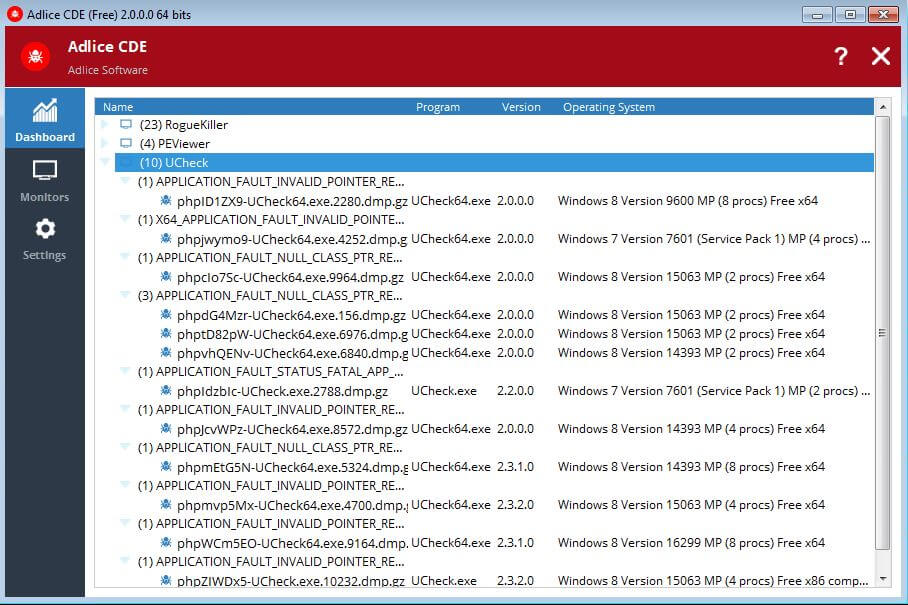
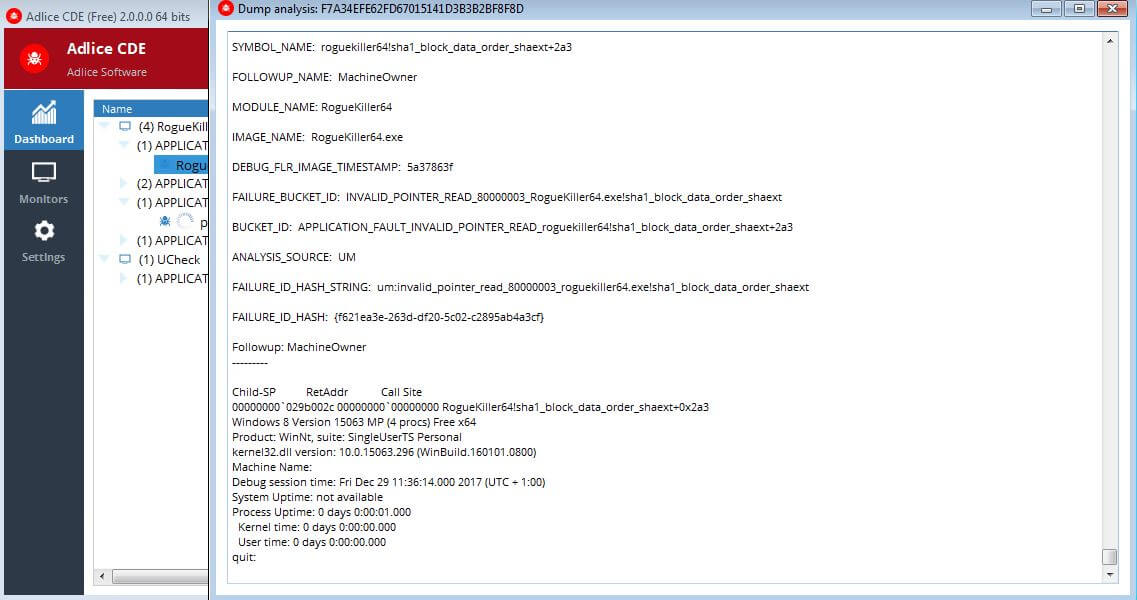
When a dump is added, it will be automatically analyzed (spinning progress icon). During this time, you can open the output console with a double click on it and watch the CDB live output.
After the dump is analyzed, the item is moved under a “Bug ID” section. That Bug ID is here to classify multiple crash dumps belonging to the same crash (same bug), to help you giving a priority on bugs and reduce the time spent on analyzing multiple dumps with the same data inside.
Please note that you can “Rename” (or add a comment rather) a Bug ID by editing its corresponding row (double click, modify text and validate with return key).
You can then open the full CDB output the same way (double click), or use context menu actions:
1. Open: Launch on with default application associated with .dmp extension (A good practice is to setup Visual Studio/Windbg)
2. Delete (full): Delete dump from the database AND the dump file (so that it’s not taken again)
3. Delete (database only): Delete dump from the database only (good for manual dumps)
4. Analyze: Restart CDB analysis and overwrite data