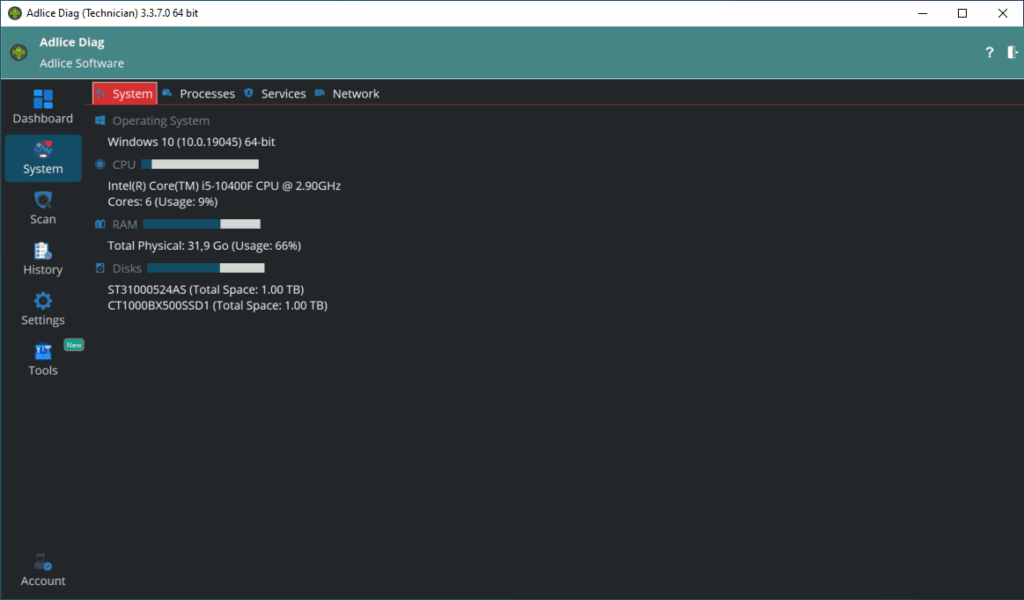
Real Time information (System tab) provides system information, updated in real time:
SYSTEM
- Operating System
- CPU (number of cores and usage)
- RAM (quantity and usage)
- Disks (types and usage)
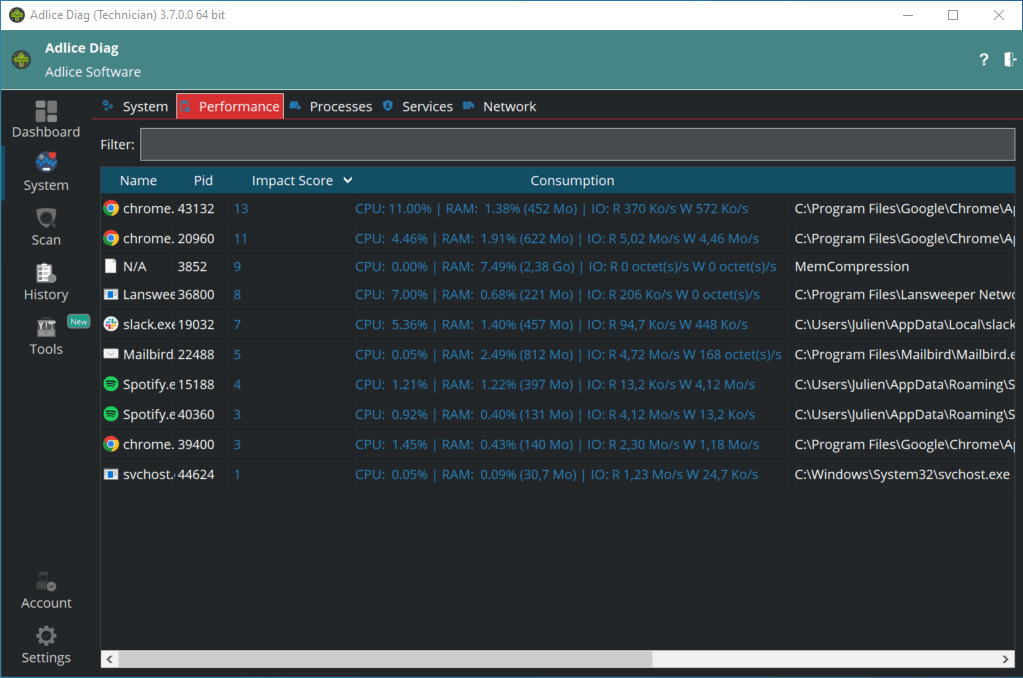
PERFORMANCE
Performance tab gives an overview of the processes that use your machine’s resources the most. They are sorted by “impact score” (percentage) giving a quick idea how bad they are acting on the system. Diag also displays real-time performance values for those processes, like CPU consumption, RAM, and disk usage.
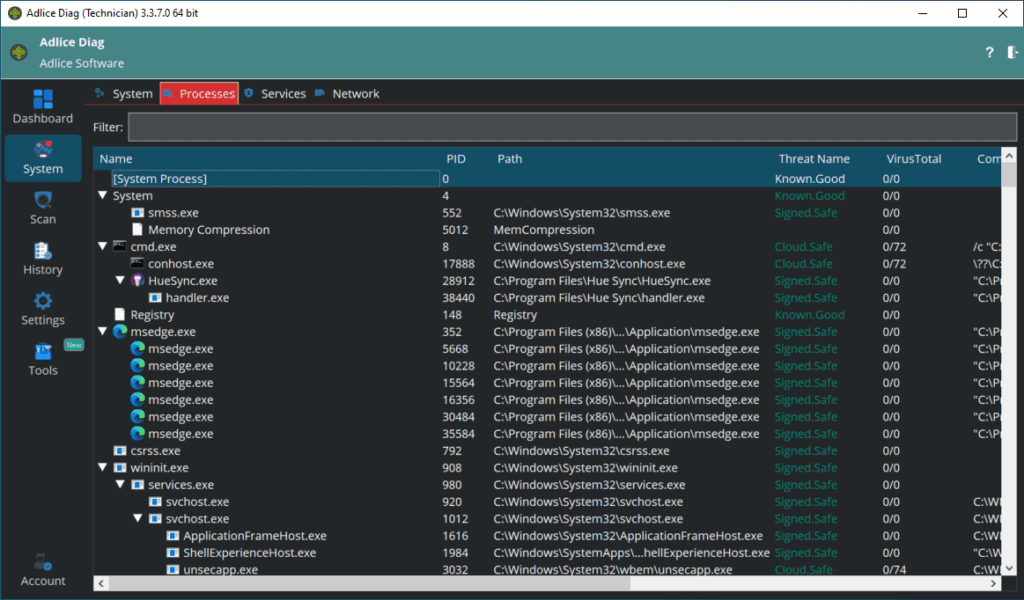
PROCESSES
Processes tab allows to see the processes currently running on the system, in real time. There is also a scan result of their disk image.
With the context menu, you can kill them one by one, or whole tree (using parent/child relationship).
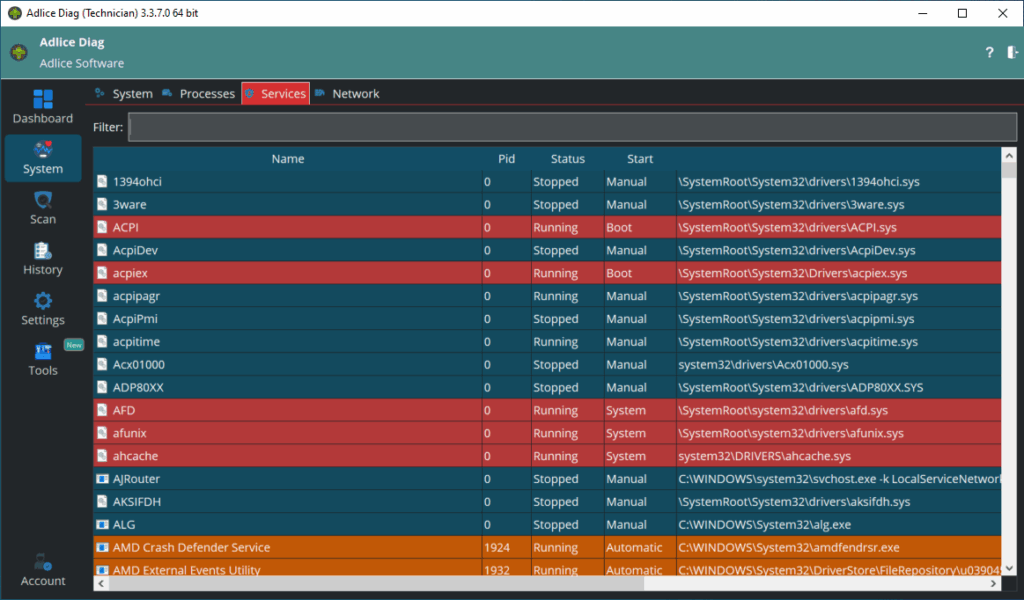
SERVICES
Services tab allows to see the services installed on the system, and their status (running, start mode). The background color reflects the value in “Start” column (Boot, Manual, System, etc…)
With the context menu, you can start or stop them.
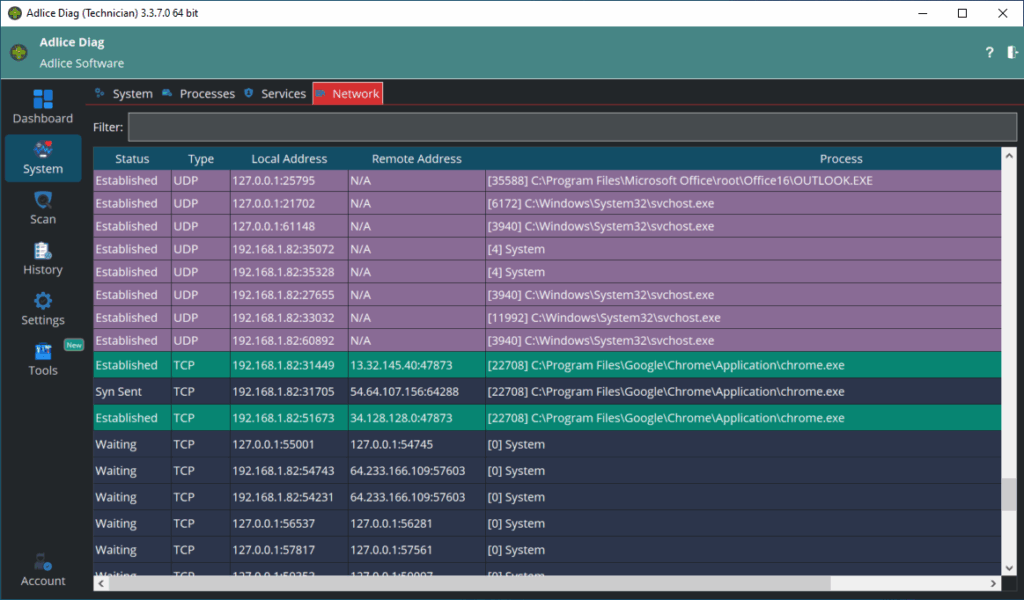
NETWORK
Network tab allows to see the sockets opened on the system, and their status (waiting, established, …). For TCP, the background color reflects the value in “Status” column (Closed, Established, etc…). For UDP this is always the same color.
It also displays which process did open the communication socket.